Smart City & Infrastructure: data your city understands
Traffic, visitor flows, air quality, water levels and energy in one platform. baiond helps cities and municipalities turn sensor data into decisions.

Different sites, the same questions.
A city does not ask for sensors. It asks whether the school street cut the morning traffic, whether the Christmas market brought anyone into the side streets, why the residents on the ring road are complaining about noise, and whether the underpass will flood tonight. The answers exist, spread over the road department, the environment office, city marketing and the state's measuring station, each with its own count, its own format and its own Saturday in May.
baiond puts the city's readings on one timeline: vehicles per class and lane, pedestrians per entrance and hour, noise and air on the residents' street, water levels, road-surface temperature, the weather and the event calendar. Counting is continuous and anonymous, classification happens on the device, and no plate, face or path of an individual leaves the sensor. A measure gets its before and after; a complaint gets its cause with a timestamp; a council question gets a chart instead of a debate.
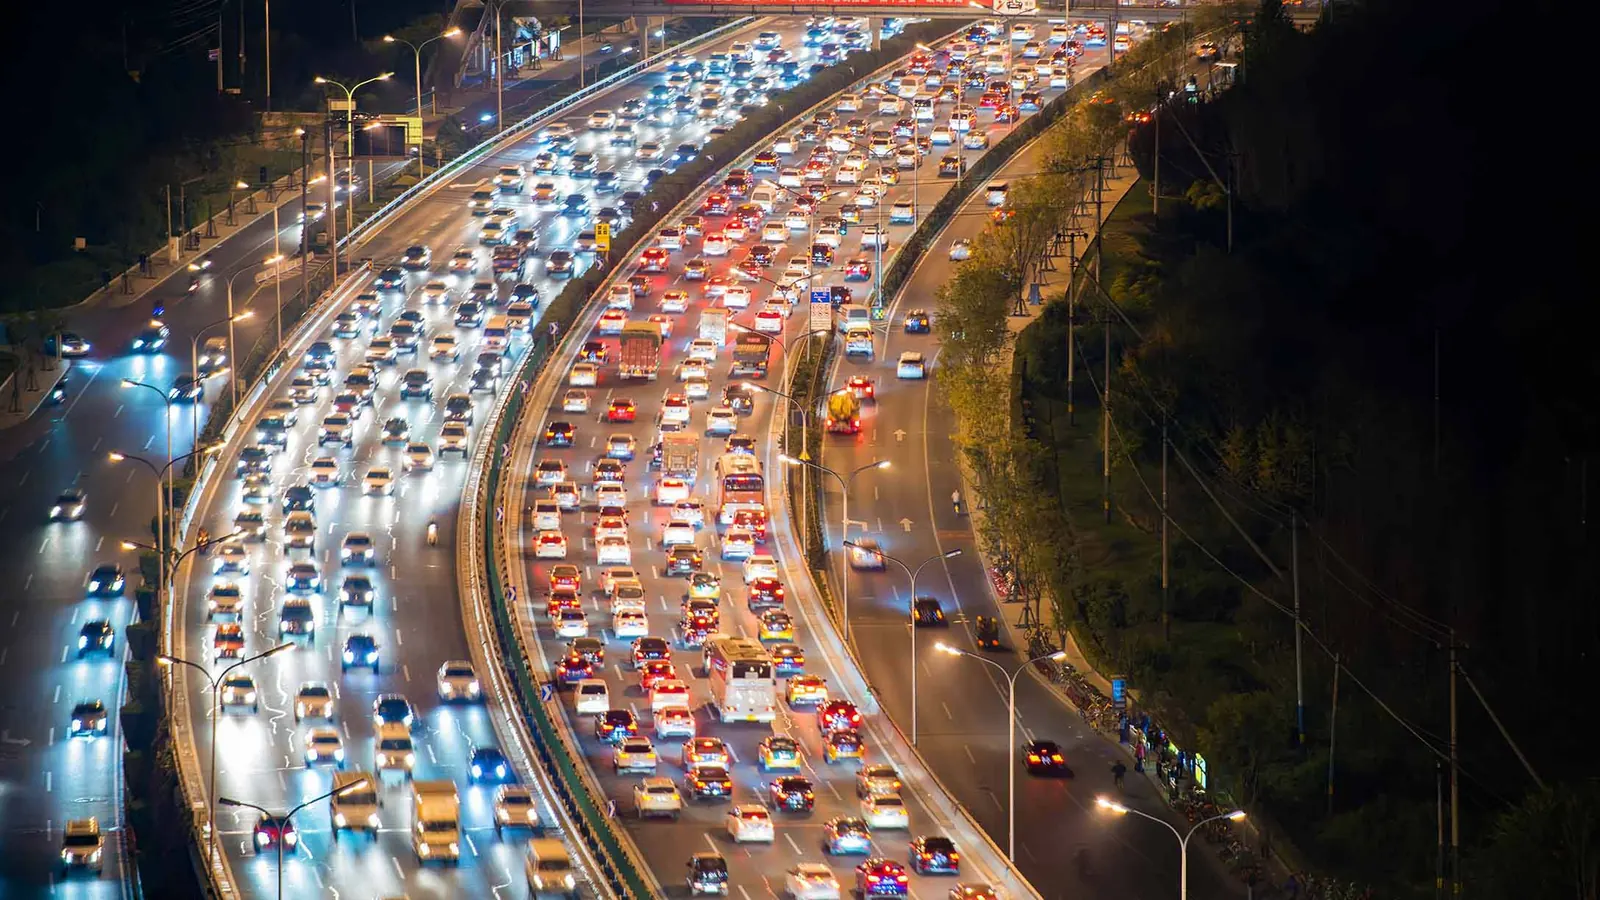
Two pages in this category go into detail. Road Traffic is about counting and classifying vehicles, cyclists and pedestrians from the intersection to the motorway corridor, with noise, air and road condition next to the count. Urban Data Analytics is about the people in the city centre: footfall, dwell time and movement patterns on squares, in pedestrian zones and at events, as the data basis for city marketing and planning. Both run on the same platform, and both answer in your words, with the source attached.
Pick your floor.
Every page speaks the language of the people who run the site: their questions, their sensors, their thresholds.
-
-

Proof from the field
-
Hofburg Congress Center Vienna
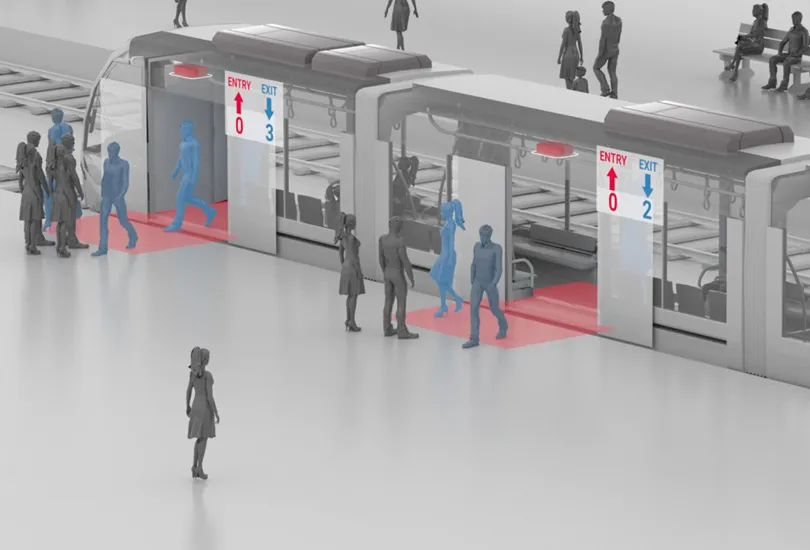
Congresses, balls and conferences in the halls of Vienna's former imperial palace: baiond counts the guests per hall as they come and go, alerts the team at the capacity limit and documents how people move.
In use at and in partnership with


Your industry guide
One PDF for your industry: the questions baiond answers there, the sensors that measure it and what changes on site.
What operators ask before they start.
Is the data anonymous and DSGVO-compliant?
Yes. Sensors and AI cameras count and classify on the device and pass on numbers: how many, which class, which direction, how long. No image, licence plate or path of an individual is stored, and the platform is hosted in the EU.
Can baiond use the counting stations and measuring points we already have?
Usually yes. The baiond Gateway reads existing loops, radar, weather and air stations over Modbus, MQTT or the manufacturer's interface, so old counts and new sensors end up on the same timeline.
Who in the city gets access?
The roles you define: the road department sees every counting point, city marketing the frequency reports, the environment office noise and air, a retailers' association the street it sponsors. Every number carries its source and period, and a report is an export, not a meeting.
How does a small municipality start?
With one question and the counting points that answer it: an intersection and the residents' street for a traffic measure, the entrances to the pedestrian zone for a frequency baseline. The sensors mount on existing lamp posts or facades, and the next question adds the next point.
Ready to give your data a voice?
Thirty minutes with the baiond team about your site and your questions. No slides.
Request a consultation