Graph Builder: dashboards that answer your questions
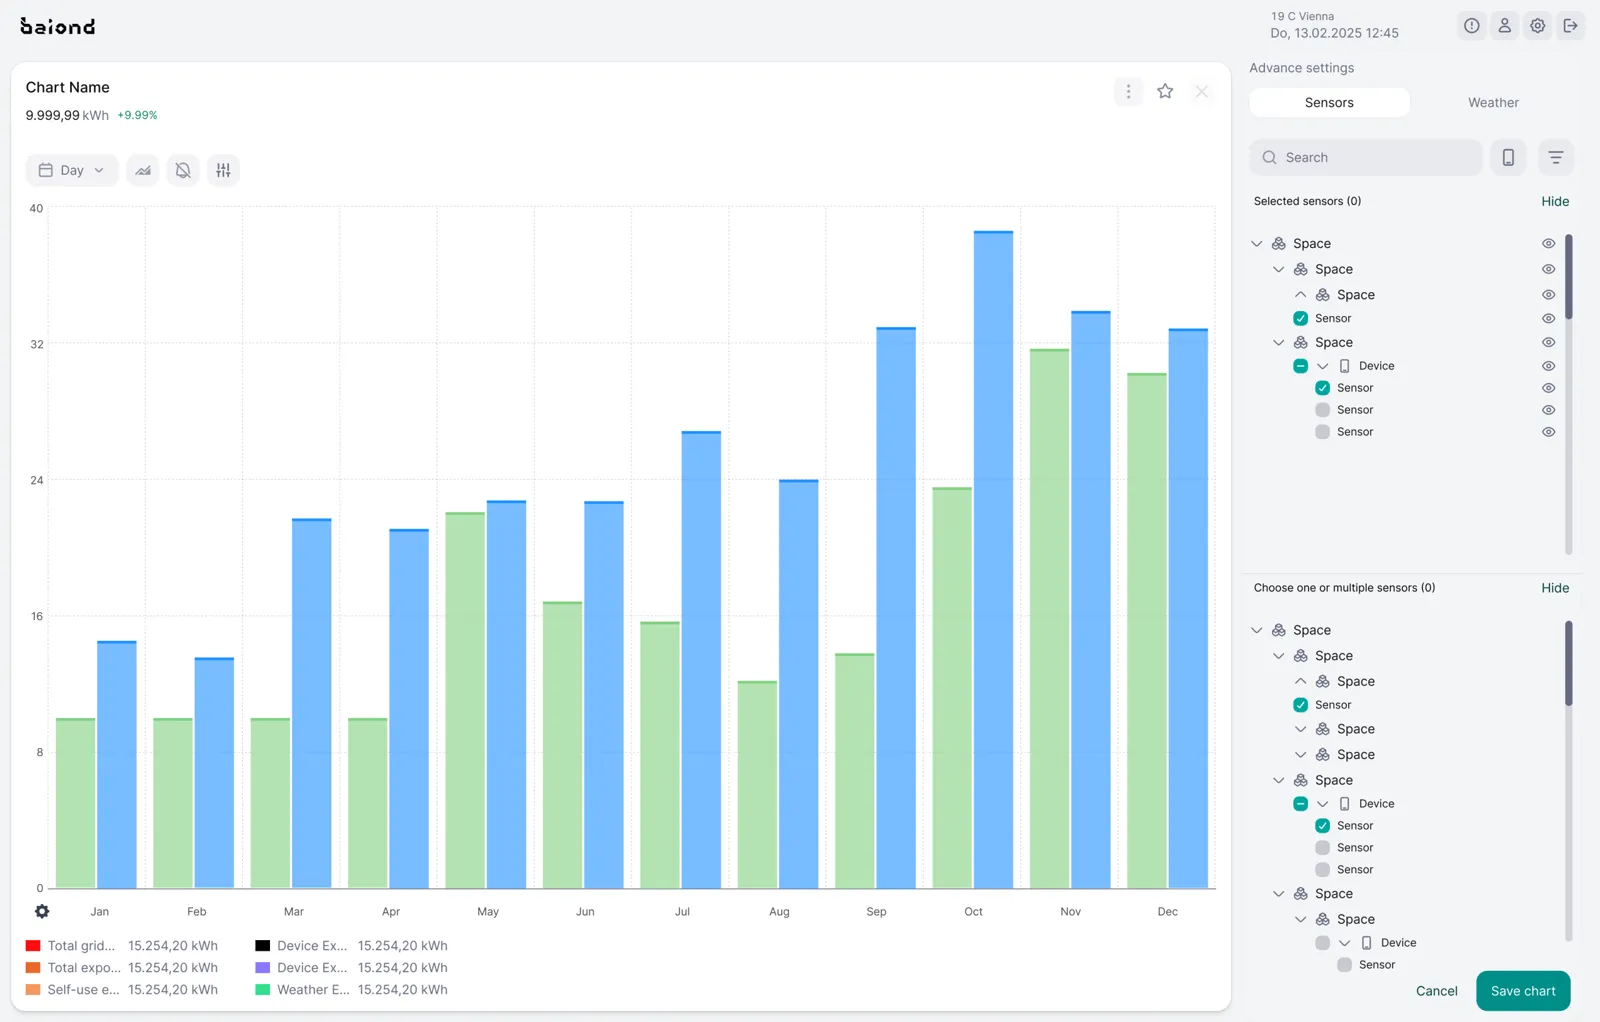
You know the question — "Why does store 07 use more energy than store 04?" The Graph Builder puts both next to each other over the last four weeks, without a single line of code and without waiting for IT.

In one sentence
The Graph Builder is baiond's no-code tool for charts and dashboards: pick data from sensors, meters, weather and satellites, choose a time range and a chart type, and the view is built in a few clicks.
Standard dashboards answer the questions someone else thought of. The Graph Builder lets you build the view for your own question: which data, which places, which period, which chart.
You choose from everything baiond knows — sensor readings, meters, weather, satellite data — and from every space in your Space System. Compare two stores over four weeks, put outdoor temperature next to heating energy, show a heat map of a building by floor. Live values and time series of several weeks work the same way.
A chart you build once can be saved to a dashboard, shared with your team or exported for an audit or an ESG report. When the next question comes, you start from the last view instead of from scratch.
What changes for you.
-
Your question, your chart
Combine data from different sources and places in one view, tailored to what you need to decide — no coding required.
-
Patterns you would otherwise miss
Time series over weeks make night-time consumption, peaks and drifts visible, together with the weather that explains them.
-
Ready for reports
Save views to dashboards, share them with your team and export them for audits, ESG reporting or the next management meeting.
See it answer.
A question only this function makes answerable, answered the way baiond answers: readings, reasons, a recommendation and the source.
Checked Energy meters · ventilation (Modbus) · Space System · Graph Builder How did baiond know?
- Sensor
- baiond Gateway
- Space System
- AI agent
The sensor reports to the baiond Gateway, the Space System puts the reading in context (location, threshold, history), and the AI agent turns it into an answer.
Source: Energy meters · ventilation (Modbus) · Space System · Graph Builder
- Store 07 18.6MWh
- Store 04 14.2MWh
- Gap at night 62%
Store 07 used 18.6 MWh, 31 % more than store 04 with 14.2 MWh at the same floor area. 62 % of the gap falls between 22:00 and 06:00, when both stores are closed.
Align the ventilation schedule of store 07 with store 04. I have saved the comparison as a dashboard so you can track the effect.
Shall I add the other stores to the comparison?
Looking closer. This is what the data shows:
Possible reasons- Ventilation in store 07 runs at full speed through the night
- Night base load 07: 21 kW, store 04: 9 kW
- Daytime consumption per m² is almost the same in both stores
The sensor reports to the baiond Gateway, the Space System puts the reading in context (location, threshold, history), and the AI agent turns it into an answer.
- Sensor
- baiond Gateway
- Space System
- AI agent
Source: Energy meters · ventilation (Modbus) · Space System · Graph Builder
Understood. I keep watching Stores 04 + 07 · last 4 weeks and let you know if anything changes.
For technical readers
Protocols, data model and integration, for the colleague who signs off on the architecture.
Data sources
Every data point in baiond: sensor and meter readings via the baiond Gateway, weather data, satellite indices, camera classifications and values calculated from them. Filter by space, device type or attribute.
Charts
- Line and area charts for time series
- Bar charts for comparisons between spaces
- Heat maps by time or by floor
- Gauges and tables for live values
Calculations
Aggregate by hour, day, week or month (sum, average, minimum, maximum), normalise per square metre or per visitor, show differences between two periods or two sites.
Sharing & export
Save to personal or team dashboards, share with colleagues, export as CSV, PDF or image.
One station in the data flow.
Related industries
Where this function carries the answer.
-

-

-

-


Related sensors
The sensor families that feed it most often.





Ready to give your data a voice?
Thirty minutes with the baiond team about your site and your questions. No slides.
Request a consultation