Urban Data Analytics: who, when, how long
Footfall, dwell time and movement patterns in city centres, on squares and at events, measured continuously and anonymously. The data basis for city marketing, planning and the shop that asks whether the Saturday market brought anyone.

What goes wrong quietly.
A city centre nobody counts
Whether the pedestrian zone is busier than last year, whether the shopping street loses people to the mall on the ring: the answer is a feeling from the retailers' association and a count somebody did on one Saturday in May.
Events without a before and after
The Christmas market, the street festival, the late-night shopping: it cost money, it felt full, and nobody can say how many more people came, how long they stayed and whether the side streets saw any of them.
Weather that explains everything and nothing
A weak week is blamed on the rain, a strong one credited to the marketing. Without the frequency next to the weather, air and events on one timeline, every measure is judged by anecdote.
Where the sensors sit.
Every dot is a sensor family in its typical place. Select one to see what it measures and what baiond does with it.
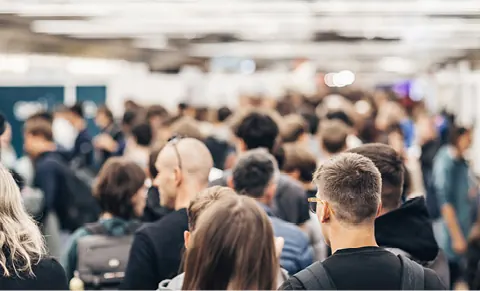
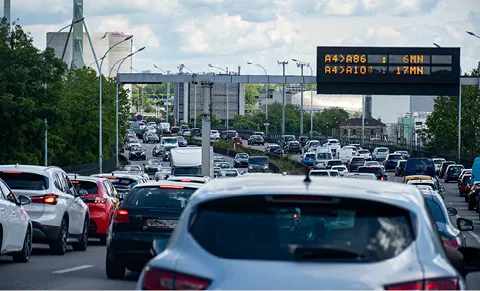
baiond counts continuously where the city happens: AI cameras and sensors at the entrances to the pedestrian zone, on the square and in the side streets record frequency, direction and dwell time, anonymously and on the device. Weather, air quality, parking occupancy and the event calendar sit on the same timeline, so a measure gets its before and after, and a weak week gets its reason. City marketing, planning and the retailers see the same chart, and a question like "did the Saturday market bring anyone into the side streets?" gets an answer with numbers.
-
-
-
-

-



The same site, run differently.
One count on a Saturday in May, and a feeling for the rest of the year.
Frequency per entrance, hour and weekday, all year, compared with last year.
The street festival felt full. Nobody knows what it brought.
Visitors, dwell time and the side streets before, during and after, on one chart.
A weak week is blamed on the rain.
Frequency next to the weather: how much the rain really cost, per day.
Proof
-
Hofburg Congress Center Vienna
Congresses, balls and conferences in the halls of Vienna's former imperial palace: baiond counts the guests per hall as they come and go, alerts the team at the capacity limit and documents how people move.
In use at and in partnership with


Your industry guide
One PDF for your industry: the questions baiond answers there, the sensors that measure it and what changes on site.
What managers ask before they start.
Is the counting anonymous?
Yes. The AI camera counts and classifies on the device and passes on numbers: how many, which direction, how long. No image, no face and no path of an individual leaves the sensor, and nothing is matched to a phone.
Can we see the effect of an event or a campaign?
Yes. Enter the event in the calendar and baiond shows frequency and dwell time for the days before, during and after, per counting point, with the weather next to it so the comparison is fair.
Who gets access, the city or the retailers?
Both, in the roles you define. The city sees every counting point, city marketing the reports, a retailers' association the street it sponsors. Every number carries its source and period.
How many counting points does a city centre need?
Usually the entrances to the pedestrian zone, the main square and two or three side streets, so five to ten points for a small city. The sensors run on mains or solar and are mounted on existing lamp posts or facades.
Related industries
Same sensors, same questions, a different floor.
-
-
-



Ready to give your data a voice?
Thirty minutes with the baiond team about your site and your questions. No slides.
Request a consultation