Satellite & Weather Data: the context for every reading
A wet wall after three days of rain means something different from a wet wall in a dry week. baiond puts the weather and the view from above next to every reading, and covers the land, roofs and plots where no sensor is installed.

In one sentence
Satellite & Weather Data is the baiond function that adds satellite imagery and current weather to your sensor data, so every reading has its context and places without sensors are still visible.
A sensor tells you what happens at one point. The weather tells you why, and the satellite shows you everything around it. baiond brings all three together, so you can read each number together with the conditions it was measured in.
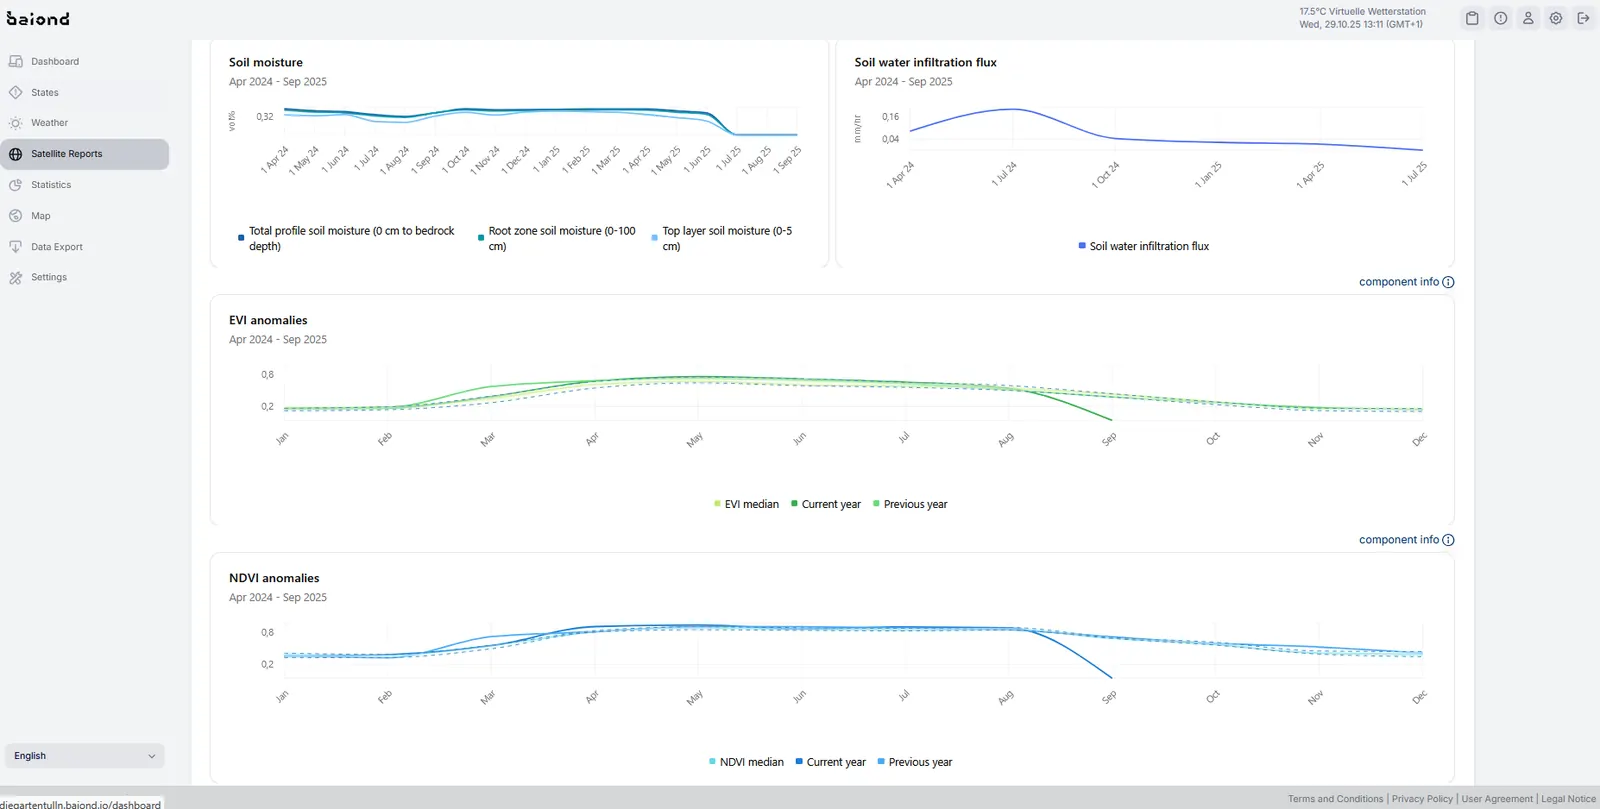
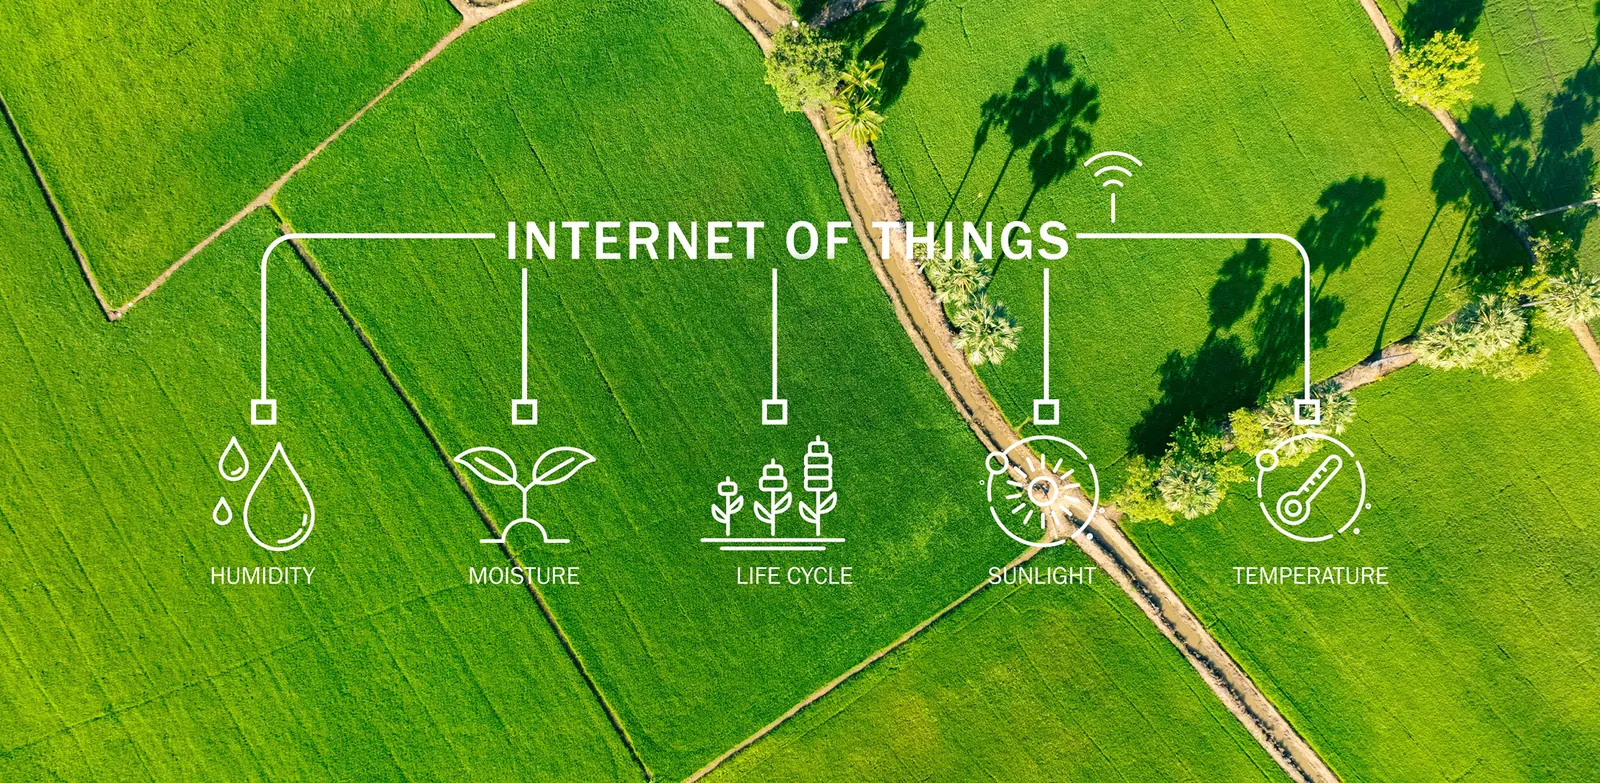
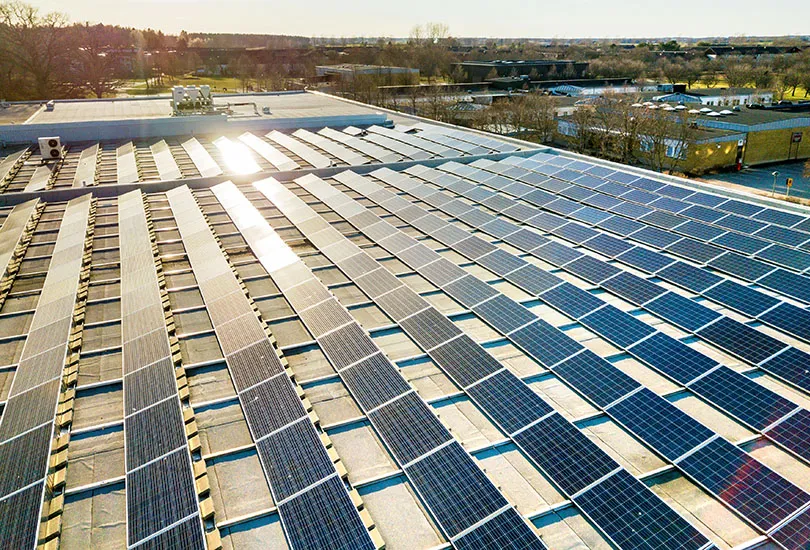
Weather data comes in regularly: temperature, humidity, rainfall, wind and air pressure at your site. baiond uses it to explain readings – the energy peak on the coldest morning, the damp cellar after a storm – and to help warn you before conditions turn. Satellite imagery covers what sensors cannot reach: the condition of vegetation, heat on large roofs, dry patches across hundreds of hectares.
On a vineyard, that means you know the south slope is drying out – vegetation well below the healthy range, 3 mm of rain in two weeks – without a single sensor on that slope.
What changes for you.
-
Readings that explain themselves
Every value sits next to the weather it was measured in, so you can tell a real problem from a rainy week.
-
Coverage without hardware
Fields, forests, roofs and remote sites become visible from above, even where installing sensors does not pay off.
-
Changes over seasons
Compare this summer with the last one and document progress for audits, ESG reports or funding bodies.
See it answer.
A question only this function makes answerable, answered the way baiond answers: readings, reasons, a recommendation and the source.
Checked Satellite imagery · Weather data · Space System How did baiond know?
- Sensor
- baiond Gateway
- Space System
- AI agent
The sensor reports to the baiond Gateway, the Space System puts the reading in context (location, threshold, history), and the AI agent turns it into an answer.
Source: Satellite imagery · Weather data · Space System
- Vegetation index 0.41NDVI
- Healthy vines 0.60–0.75NDVI
- Rain, 14 days 3mm
The south slope. Satellite imagery puts its vegetation index at 0.41, below the 0.60–0.75 of healthy vines, and only 3 mm of rain fell in the last 14 days. The other plots are within range. There is no sensor on that slope – this reading comes from above.
Irrigate the upper rows of the south slope first, in the early morning. baiond checks the next satellite pass and tells you whether the vines recover.
Shall I compare the slope with last summer?
Looking closer. This is what the data shows:
Possible reasons- The south-facing slope gets the most sun and loses water fastest
- Only 3 mm of rain in two weeks during the ripening period
- Shallow, stony soil on the upper rows holds little water
The sensor reports to the baiond Gateway, the Space System puts the reading in context (location, threshold, history), and the AI agent turns it into an answer.
- Sensor
- baiond Gateway
- Space System
- AI agent
Source: Satellite imagery · Weather data · Space System
Understood. I keep watching Winery · South slope, 6.2 ha and let you know if anything changes.
For technical readers
Protocols, data model and integration, for the colleague who signs off on the architecture.
- REST
Weather
Current measurements for each site, attached to every reading in the Space System:
- Temperature, humidity, rainfall, wind, air pressure
- Forecasts for warnings ahead of frost, heat, storms and heavy rain
- An own weather station on site can be connected through the baiond Gateway
Satellite
High-resolution satellite imagery, analysed by AI to show changes in environment, climate and vegetation at scale:
- Vegetation condition (e.g. NDVI)
- Surface temperature and heat hotspots
- Changes in land use and surfaces over time
Heat map
The dynamic heat map shows values spatially and over time – energy use across a portfolio, heat across a district, vegetation across a site – so you see where the hotspots are and where action pays off most.
Combining data
Satellite and weather layers live in the same Space System as your sensors. AI agents and Graph Builder use them like any other source: ask "Did the rain explain last night's moisture alarm?" or chart rainfall against soil moisture over a season.
One station in the data flow.
Related industries
Where this function carries the answer.
-

-
-

-


Related sensors
The sensor families that feed it most often.





Ready to give your data a voice?
Thirty minutes with the baiond team about your site and your questions. No slides.
Request a consultation